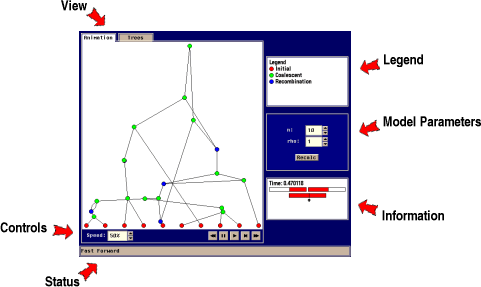
The Hudson animator consists of a number of tools for visualization
of the coalescent process under different assumptions.
The principle of the animator is illustrated below for the
case of the Coalescent with Recombination. Other case: Coalescent
with Migration, Coalescent with Growth and Coalescent with Selection
are explained in the last part of this document.
Coalescent with recombination
The principle is based on Hudson's (1983) algorithm which included
recombination into Kingman's (1982) Coalescent process. The
coalescent with recombination for a sample of genes is defined by
exponentially distributed waiting times for either coalescent or
recombination. Coalescent events merge two sequences into one,
whereas recombination breaks up the sequence in two (corresponding to
the two different sequences that recombined to form the sequence in
question). Since recombination splits up sequences, the process
results in a graph rather than a tree. This graph has been termed the
ancestral recombination graph (Griffiths and Marjoram 1996).
The Hudson animator illustrates how this ancestral
recombination graph is constructed, including which time
coalescent/recombination events happen, which sequences merge, where
recombination breaks up the sequences, and when the most recent
common ancestor (MRCA) of the sample is found for each part of the
sequence.
From the ancestral recombination graph it is possible to extract the
real coalescent tree for each point the the sequence. This is
illustrated in the Trees part of the animator.
|
- View
- Use the fans to
swap between the ancestral recombination graph the trees extracted from the graph.
- Controls
- Use the
control panel to control the animation. The controls are the following:

Rewind |

Step Back |

Pause |

Play |

Step |

Go to end |
The animator operates similar to a video recorder. Once an animation
is loaded into the animator, it is possible to 'Play' it, 'Pause' it,
'Rewind' it and so on. Note that the controls do not
change the ancestral recombination graph, only the
visualization of it.
- Status
- The status
bar shows useful information about the current state of the
animator and gives help on some of the components in the animator
(eg. when moving the mouse pointer across certain components).
- Legend
-
Key to the different kinds of nodes in the animator.
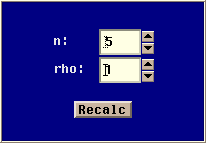
- Model Parameters
- This panel allows you to change model specific parameters. The
parameter panel for the coalescent with recombination model is the
following:
 |
|
The model has two parameters:
n : Sample size
rho : Rate of recombination
|
- Info
- Information about nodes in the ancestral
recombination graph. This includes the time of nodes (measured
backwards from time 0 in 2N generations, N being the effective
population size) and other kinds of model specific information.
The information is changed whenever the mouse pointer moves across a
node in the graph.
In the recombination model only two types of nodes exist: Coalencent
nodes and Recombination nodes. The two types display a different kind
of information, as illustrated in the following figures:
 | |
 |
| Coalescent info | |
Recombination info |
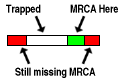
Coalenscent nodes display information about the part of the sequence
finding most rescent common ancestor (green), the part of the sequence still
missing most recent common ancestor (red) and the part of the sequence that
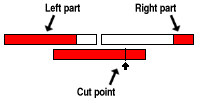
is trapped (white). Recombination nodes display information about the point on
the sequence where the recombination takes place and the parts that
remain after splitting the sequecne according to the recombination
point.
|